Welcome to the latest edition of State of the Screens.
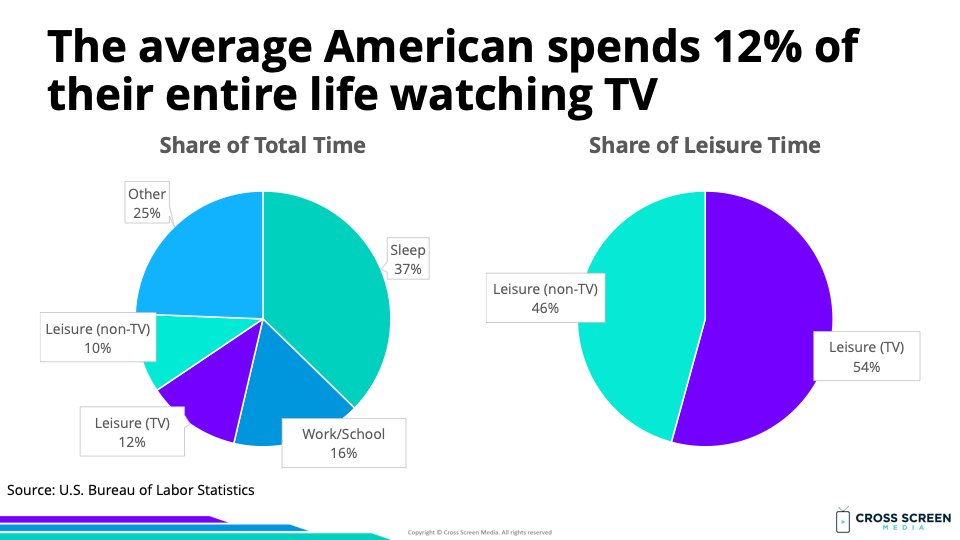
1. The average American spends 12% of their entire life watching TV
Seven big questions re: How we watch TV:
1) How much of our life do we spend watching TV?
2) Which state watches the most TV?
3) What share of the population watches TV daily?
4) Is broadcast/cable gaining ground on streaming?
5) Which streaming apps account for the highest share of total TV?
6) Which streaming apps reach the largest population share?
7) What share of households have a connected TV?
Big question #1: How much of our life do we spend watching TV?
Quick answer: 12%
Big question #2: Which state watches the most TV?
Quick answer: West Virginia w/ 3h 58m per day.
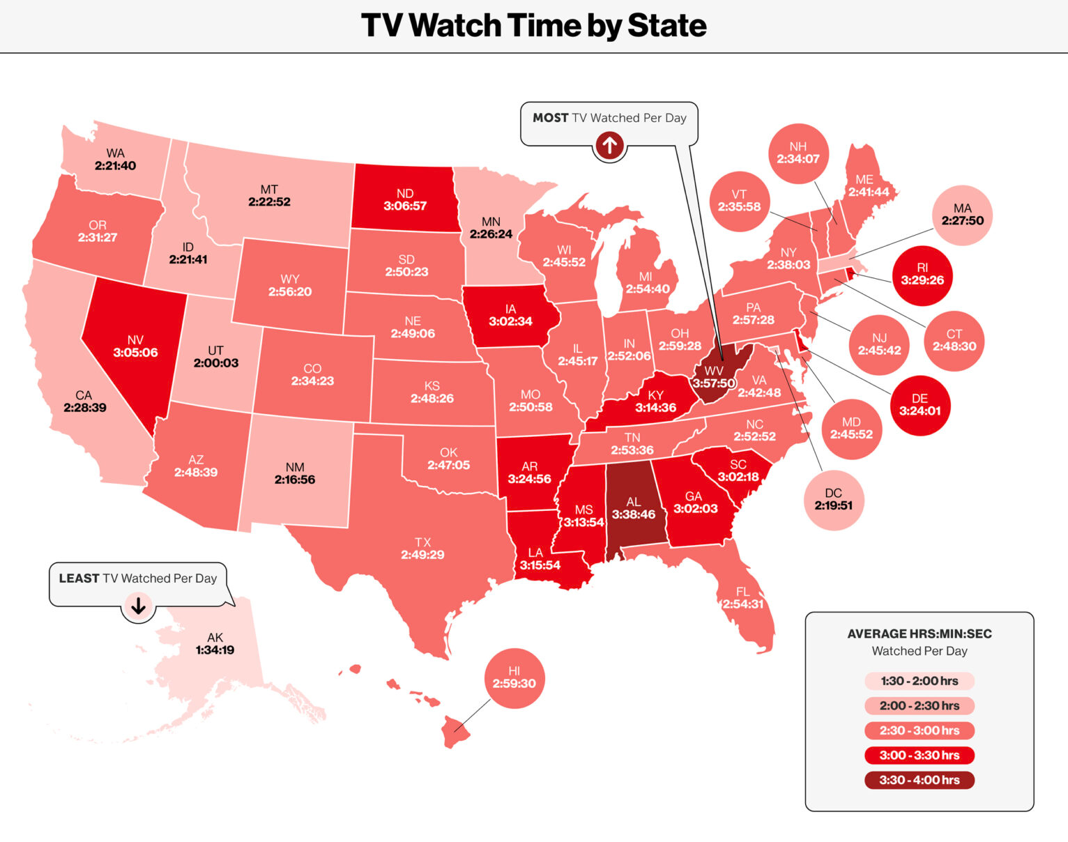
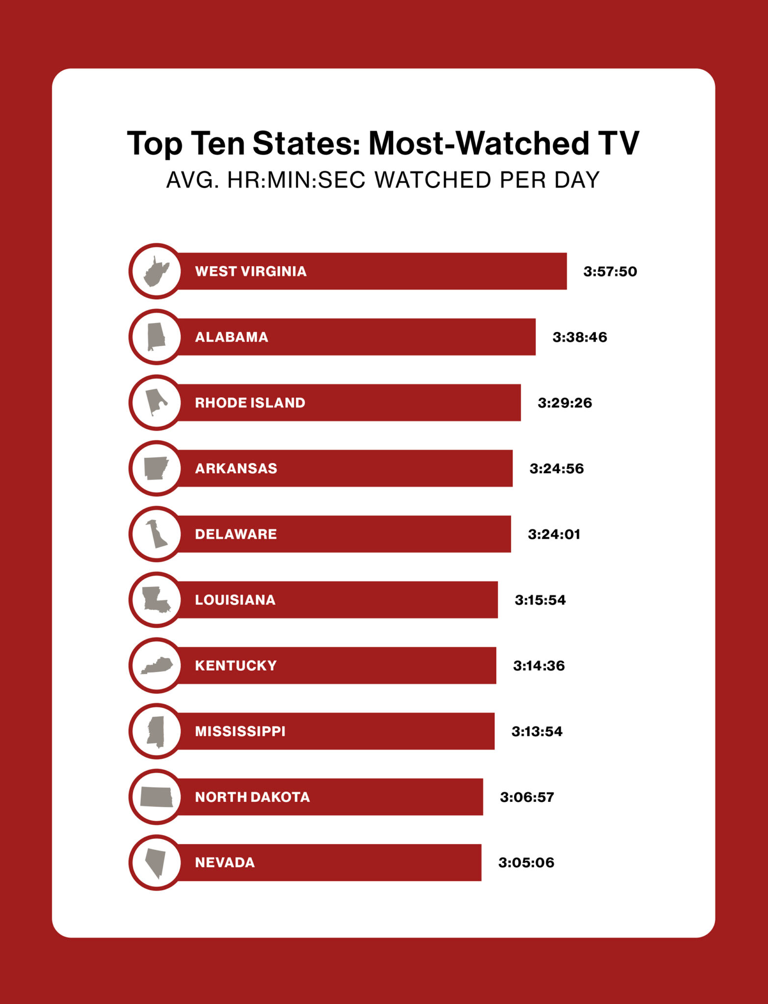
Top 5 states ranked by daily time spent watching TV according to the U.S. Bureau of Labor Statistics:
1) West Virginia – 3h 58m
2) Alabama – 3h 39m
3) Rhode Island – 3h 30m
4) Arkansas – 3h 25m
5) Delaware – 3h 24m
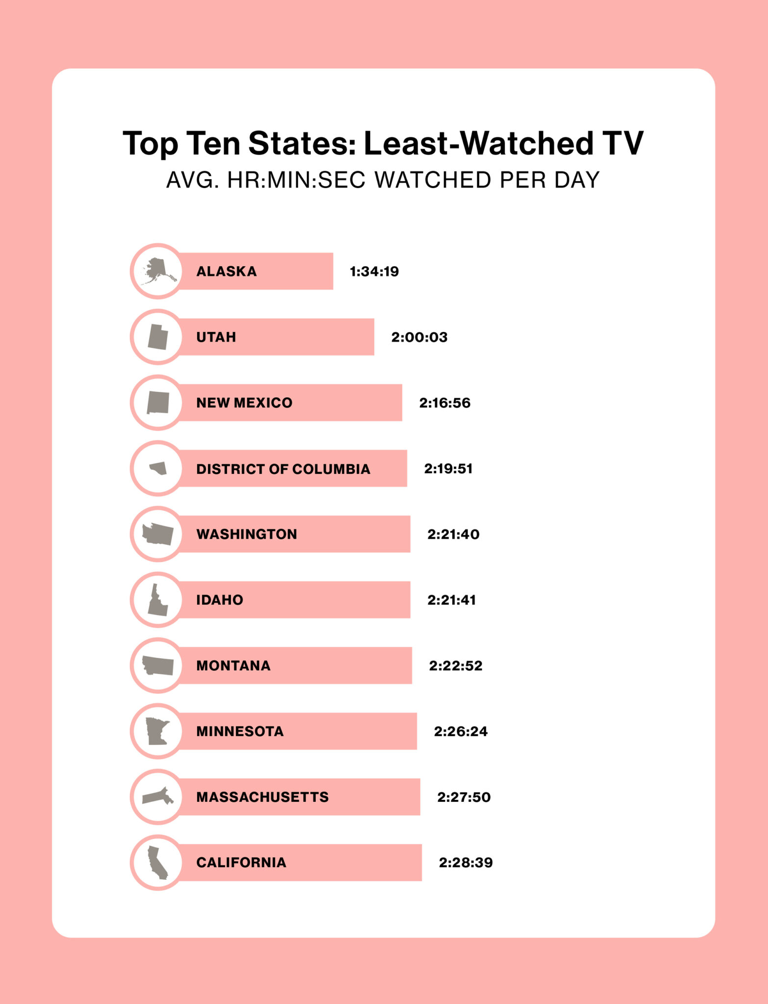
Bottom 5 states ranked by daily time spent watching TV according to the U.S. Bureau of Labor Statistics:
1) Alaska – 1h 34m
2) Utah – 2h 0m
3) New Mexico – 2h 17m
4) District of Columbia – 2h 20m
5) Washington – 2h 22m
Big question #3: What share of the population watches TV daily?
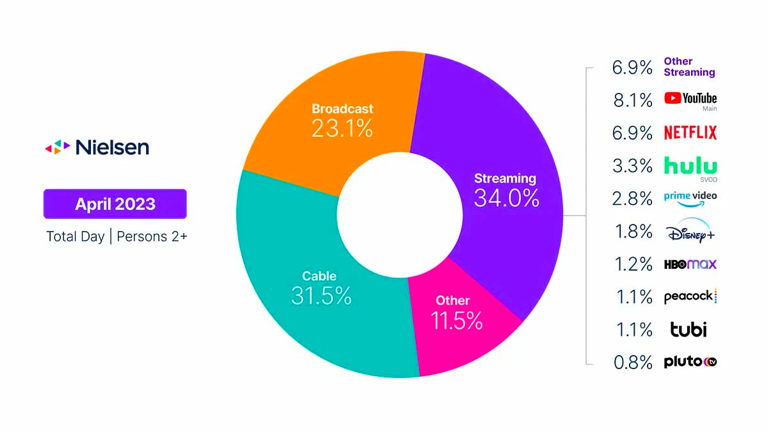
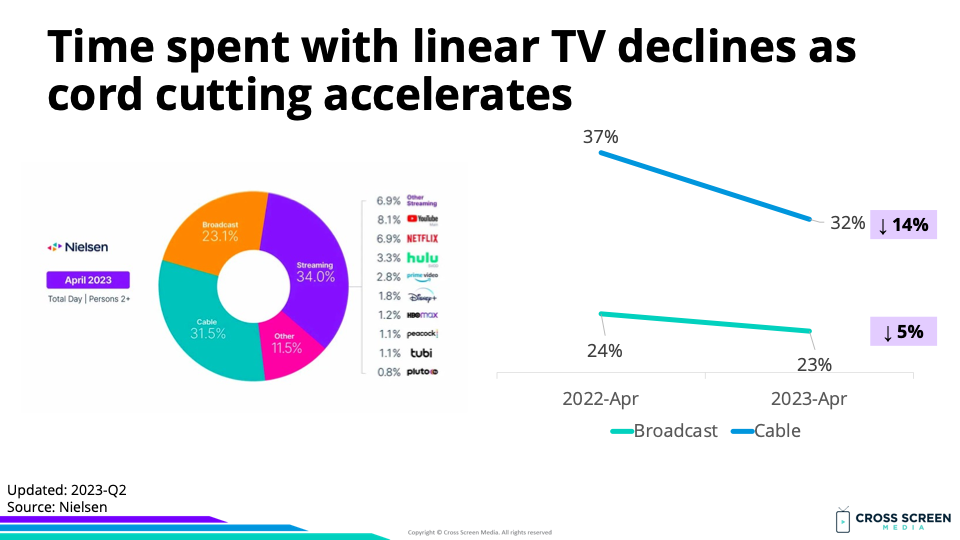
Big question #4: Is broadcast/cable gaining ground on streaming?
Quick answer: No. Time spent with linear TV declined 10% YoY.
Share of total TV time according to Nielsen:
1) Streaming – 34%
2) Cable – 32%
3) Broadcast – 23%
4) Other – 12%
Big question #5: Which streaming apps account for the highest share of total TV?
Share of total TV time (streaming only):
1) YouTube – 8%
2) Netflix – 7%
3) Hulu – 3%
4) Amazon Prime – 3%
5) Disney+ – 2%
6) HBO Max – 1%
7) Peacock – 1%
8) Tubi – 1%
9) PlutoTV – 1%
10) Other – 7%
Big question #6: Which streaming apps reach the largest population share?
Household reach by streaming app according to TVision:
1) Netflix – 61%
2) YouTube – 55%
3) Hulu – 49%
4) Amazon – 49%
5) Disney+ – 37%
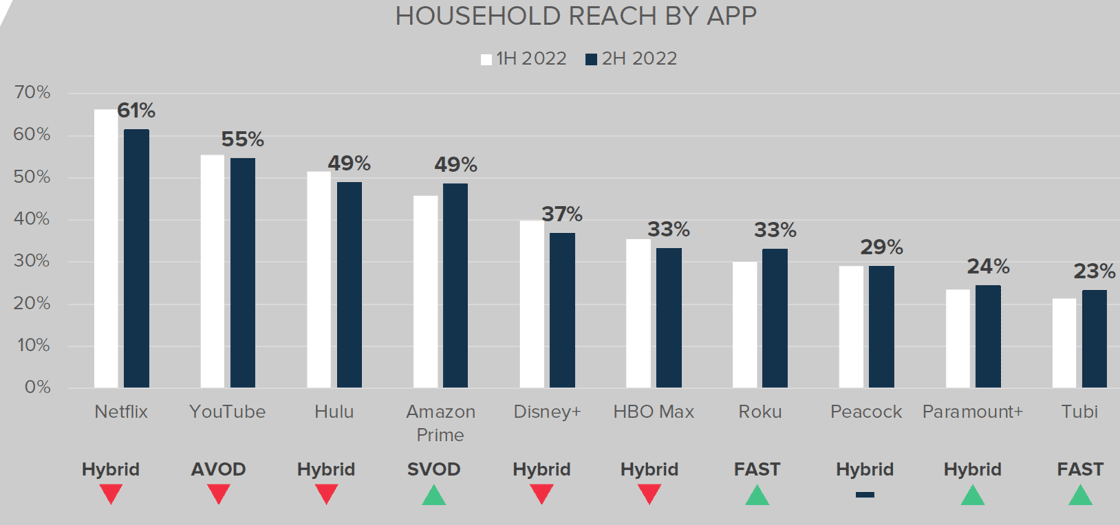
Why this matters: You can’t spend time (Big question #5) with an app you don’t subscribe to and/or have access to. This chart is a leading indicator. For example, Paramount+ will not rival Netflix for time spent when it has roughly 1/3 of the subscriber base.
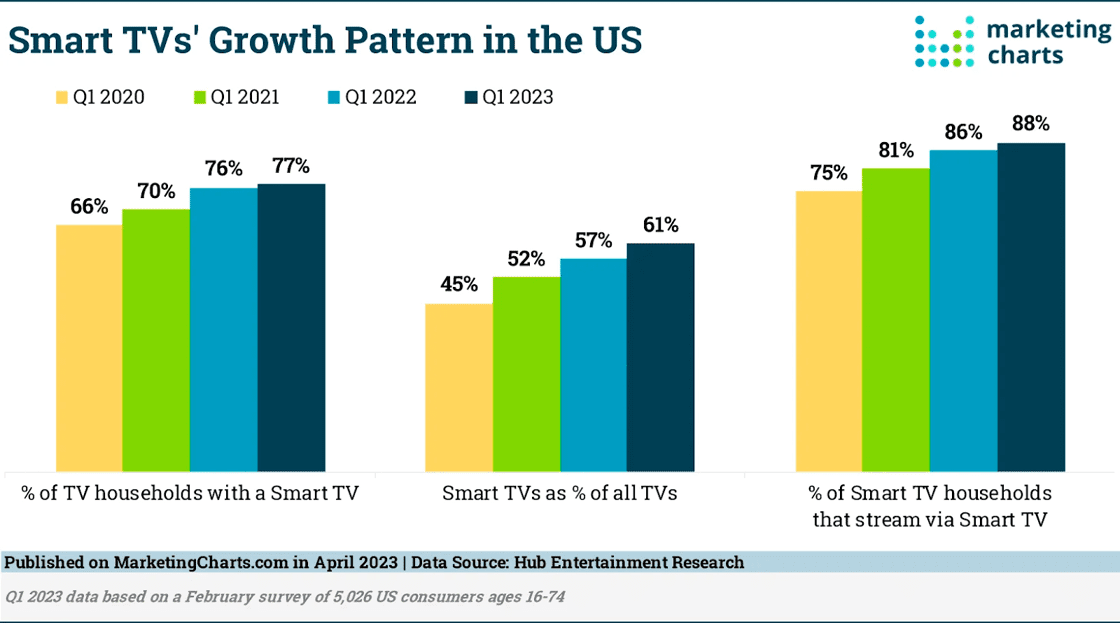
Big question #7: What share of households have a connected TV?
Quick answer: 77%