Video Benchmarks 2018
This comprehensive report, based on the latest aggregate performance metrics from ER’s robust proprietary video ad server within AdBridge, tracks campaigns for a diverse set of brands across multiple categories. Our industry-wide snapshot identifies emerging ad performance trends as indicated by such metrics as viewer click-through, video ad completion and viewability rates, as well as invalid traffic and time spent. It also provides breakdowns related to these numbers based on media destination (i.e., premium publisher vs. media aggregator) and device (i.e., desktop, mobile, tablet and connected television [CTV]).
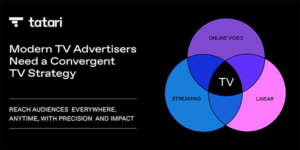
And it’s clear—consumers love CTV!
TV viewers’ enthusiastic embrace of connected TV platforms is having a transformative effect on the entire video advertising ecosystem. Over the last few years, consumer adoption of CTV has soared to about 190 million users and shows no signs of stopping. To keep up with the 57% of the population that has migrated from linear TV to, say, Roku or Apple TV or ad-supported streaming services, advertisers have followed suit—albeit cautiously at first. And while eMarketer notes that CTV likely represents only a small piece of overall digital ad spend, it’s clear from our video ad serving data that CTV investments are having an outsize impact on advertisers’ ability to connect and engage with hard-to-reach audiences.
In fact, this latest data shows that CTV ad impressions grew from 15% in Q4 2017, to 44% in Q4 2018—a stunning 193% increase. We also see CTV having a halo effect on other areas, including increased average ad length and higher video completion rates for premium publishers.
Dive in for more and don’t hesitate to reach out with questions and feedback.